Business Intelligence (BI) refers to the technologies, processes, and tools that enable businesses to collect, analyse, and present key information to support decision-making processes. Business Intelligence Tools transforms raw data into meaningful insights, providing a comprehensive view of the organisation’s performance and aiding strategic planning.
Big data is becoming increasingly common, and businesses are becoming increasingly aware of the need to use it. Because they have access to so much information, they need to be able to handle and analyze it well.
In what ways do business data tools help?

Business intelligence tools are software programs, platforms, and solutions that help organizations analyze data, spot trends, and make strategic decisions. They do this by extracting, transforming, and presenting data differently. With these tools, you can turn raw data into useful insights to help you make better decisions, run your business more efficiently, and stay competitive in today’s data-driven markets.
You might be curious about what business intelligence tools are in the market and how BI tools can do all of that, even if it sounds amazing. To answer this question, let’s look at the four main things that BI tools can do:
- Business intelligence ETL tools can connect to and combine data from many sources, like databases, spreadsheets, and cloud-based apps.
- Data transformation: because data can be in many forms, this part of BI tools is very important for making the data more compatible and useful. Cleaning, organizing, and combining data are all things that users can do to change it.
- The most important thing about business intelligence is its ability to visually show big, often complicated information so that insights can be gained and patterns and trends can be seen more clearly.
- Reporting: A BI tool’s final way of showing data is through a report or dashboard that can be sent immediately to essential people.
Top Business Intelligence Tools in 2024
1- Sisense

Sisense’s primary goal is to provide AI-driven analytics that makes complicated data analysis easier to understand and available to many users. Sisense is great at turning vast amounts of data into helpful information businesses can use to make smart decisions based on real-time data.
Scalability and customization are Sisense’s main strengths that help it work with businesses of all kinds and types. Businesses that want business intelligence reporting tools open source that can change with their needs can use it because it works well with their current data systems and processes. However, the platform’s many features and functions could make it hard for non-technical users to learn how to use it.
Sisense is a powerful Business Intelligence (BI) platform that offers a range of features Here are key features of Sisense:
- Sisense utilizes a single-stack architecture, simplifying the process of data preparation, analysis, and visualization in one integrated platform.
- Sisense supports seamless integration with various data sources, allowing users to connect to and consolidate data from different databases, applications, and cloud services.
- The Elastic Data Hub feature enables users to efficiently manage large and diverse datasets, ensuring quick and responsive data processing.
- Sisense provides robust data modelling capabilities, allowing users to transform raw data into a structured and understandable format for analysis.
- Leveraging in-chip technology, Sisense performs data processing within the computer’s memory, ensuring fast query responses and improved performance.
2- Tableau

Tableau is another popular business intelligence (BI) tool that stresses making it easy for people who aren’t tech-savvy to use. Tableau has advanced data finding in market intelligence tools used in recruitment and visualization tools, as well as pre-built data connectors that make it easy to connect to dozens of other programs.
One thing that makes Tableau stand out, though, is its Tableau Public offering. This lets anyone, from beginners to seasoned pros, learn more about Tableau and improve their BI and analytical skills. If you want to learn more about Tableau, the Introduction to Tableau course from DataCamp is a great place to start. If you want to learn more about Tableau in-depth, the Tableau Fundamentals skill track is a great place to begin.
Key Factors:
- Many different data connections can connect to almost any type of data source.
- Interactive and changeable dashboards so that users can either make their own and automate them or quickly run through their data for analysis.
- Real-time data integration lets users see and study data as it changes.
Want to update your marketing goals? Then you should read this: How do marketers use TikTok to help their businesses grow?
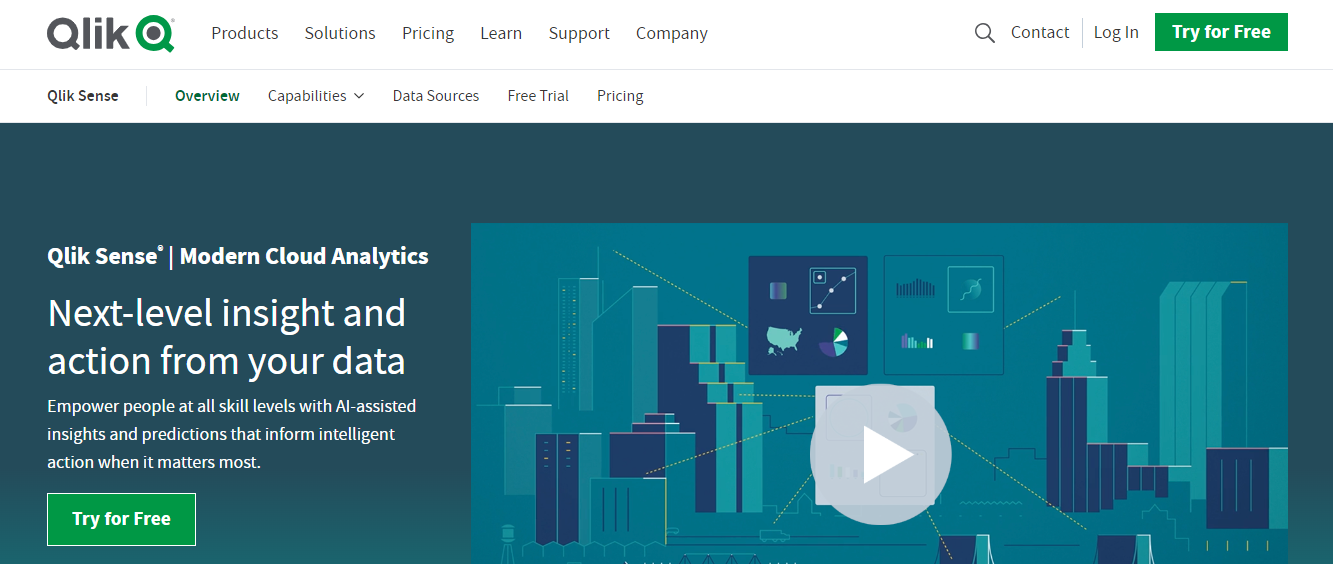
3- Qlik Sense

Qlik Sense is all about making data exploration easy and robust simultaneously. It stands out because of its advanced cloud-based platform, which makes it easy for businesses to deal with the complicated nature of current data environments.
The linked analytics engine in Qlik Sense is one of its best features. This one-of-a-kind feature lets users dynamically and interactively explore the relationships between data, which can help them find insights that traditional BI tools built on queries might miss.
Business intelligence tools features are:
Qlik Sense is a robust Business Intelligence (BI) platform known for its associative data modelling and visualization capabilities. Here are the key features of Qlik Sense:
- The associative data model in Qlik Sense lets users study and move through data relationships dynamically, making it easier to find insights.
- Enables non-technical users to create their interactive dashboards and reports without relying heavily on IT support, promoting a self-service BI environment.
- Offers extensive data connectivity, allowing users to connect to various data sources, including databases, spreadsheets, and cloud-based applications.
- Provides an intuitive drag-and-drop interface for creating visualizations and building interactive dashboards, making data exploration and analysis user-friendly.
4- Power BI from Microsoft

One of the best things about Power BI is its free desktop app and a cloud-based platform for sharing dashboards and results. Power BI is a complete tool that can change and show your data in a variety of ways. It also has some great prediction modelling and AI-based features that make it the market leader in its field.
Power BI is great for people new to business intelligence (BI) but already know how to use Microsoft tools. It makes the transition to BI easy. This lesson by DataCamp is a quick way to get up to speed on Power BI. You should take the Power BI Fundamentals skill track to improve at Power BI.
There are two ways to pay for Power BI: a Pro plan that costs per user or a Premium plan of Power BI that costs per user or capacity if you need access to advanced enterprise-scale tools.
Key Features:
- Many different types of data sources can be connected and used together.
- A drag-and-drop report builder and robust data visualization tools make the interface easy for anyone.
- Use natural language to ask questions about facts.
- Web-based—Power BI results can be put on the web and shared with others quickly and easily. In addition, Power BI Service on the web lets you create reports right there, and it works directly with some applications.
5- Domo

Domo is known for its intelligent analytics and dynamic data integration. Its platform turns simple data sets into engaging, dynamic experiences that help people make decisions and see things more clearly in business.
The best thing about Domo is its Business Apps, which both low-code and high-code users can use. These apps are very helpful for automating business insights, and speeding up the decision-making process at all company levels. Domo gives a complete picture of operations through easy-to-use dashboards and AI-generated insights. This makes it a valuable tool for companies that want ease and analytical depth.
Key features:
- Domo operates as a cloud-based solution, allowing users to access their data and insights from anywhere with an internet connection.
- Supports data integration from various sources, including databases, spreadsheets, and third-party applications, enabling a comprehensive view of organisational data.
- Provides tools for data cleaning, transformation, and preparation, ensuring that data is usable and standardised for analysis.
- Offers real-time data visualisation capabilities, allowing users to monitor and analyse data as it is generated, facilitating quicker decision-making.
Conclusion:
In 2024, business intelligence tools will continue to change and offer a wide range of options to meet the needs of different businesses. Picking the right BI tool is very important for the data-driven success of your business. These tools combine data, make it easier to see trends, and give you the power to make smart decisions.


